Orange County Housing Market Update: What July 2026's Closed Sales Tell Us
Every month, Reports On Housing publishes a detailed look at Orange County's closed home sales — pricing behavior, buyer activity, and how transactions actually played out. Here's what the July 2026 numbers show, and what it means if you're buying or selling in Orange County right now.
The Big Picture
July is the middle month of the summer market, and this year it showed a market gradually losing momentum. Supply mostly rose while buyer demand gradually cooled. Closed sales in Orange County came in at 1,930 homes for the month — down about 3% from June, and essentially flat compared to July of last year.
Mortgage rates didn't help. July was a rough month on that front, with rates touching their yearly high of 6.85%. That pressure showed up directly in how sellers priced — and repriced — their homes.
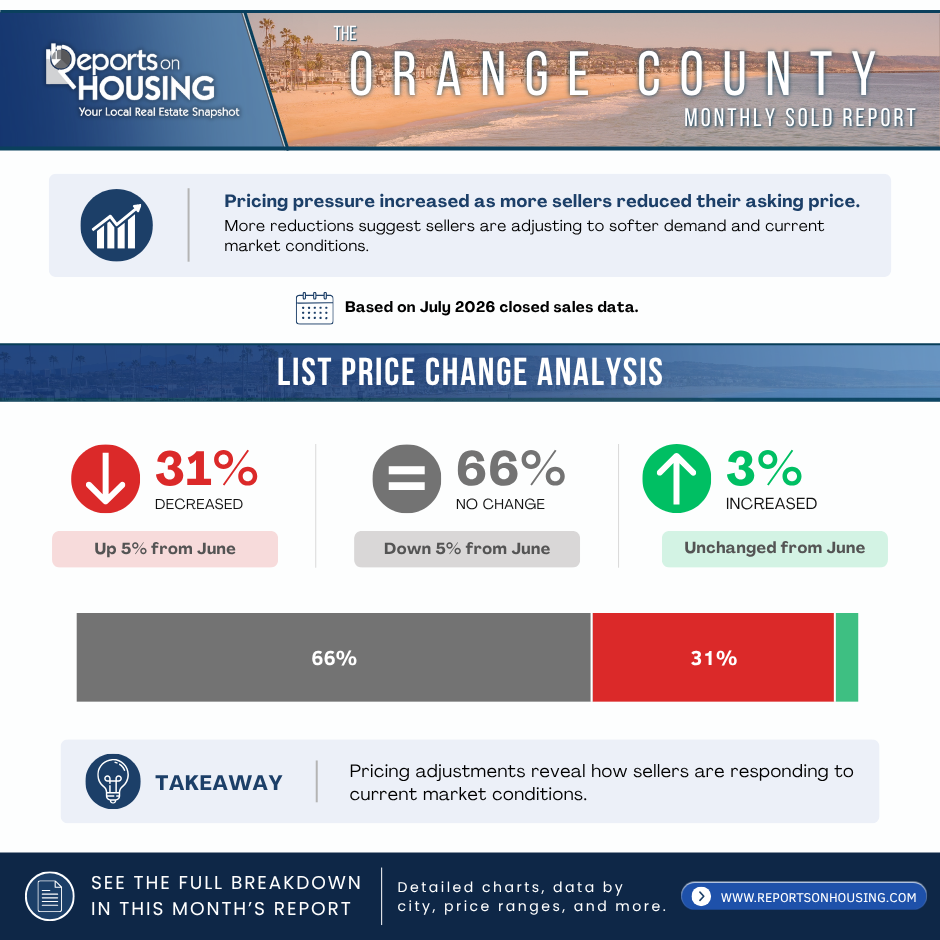
Sellers Are Adjusting Their Pricing More Often
31% of homes that closed in July had their list price reduced at some point before selling — up from 26% in June, a notable jump in just one month. Meanwhile, the share of homes that sold with no price change at all dropped from 71% to 66%.
That pricing pressure flowed through to how homes actually closed:
59% of homes closed below their original list price (up 3% from June)
52% of homes closed below their final list price (up 2% from June)
Only 28% closed above their original asking price, and 31% closed above their final list price
The countywide median sales price for July landed at $1,220,000, with homes selling at a median of 99.5% of list price.
Takeaway for sellers: first impressions matter more than ever. Homes priced accurately from the start are still closing above list more often than those that need repeated adjustments.
Cash Buyers Held Fairly Steady
Cash purchases made up 26% of all closed sales in July, essentially flat from 27% in June. The remaining 74% of buyers relied on financing — a share that's ticked up slightly as rates have made cash a relatively bigger advantage for the buyers who have it.
More Homes Are Coming Off the Market Unsold
882 homes — about 17.6% of active inventory — were pulled from the market in July without selling. That's up 7% from June, and it's one of the clearer signals in this report: sellers and buyers aren't always agreeing on price, and a growing share of listings are being withdrawn rather than sold.
Where This Leaves the Market
As we move from summer into the fall and holiday season, expect the normal seasonal slowdown to continue — and expect fewer sellers to close successfully at their original price unless mortgage rates ease. If you're thinking about listing, getting the price right from day one is the single biggest lever you control in a market like this.
Want the Full Charts?
Reports On Housing publishes detailed visual breakdowns of these trends each month. You can view their latest Orange County market charts and report excerpt here:
Data source: Reports On Housing, Orange County July 2026 Sold Report. Have questions about how these trends apply to your neighborhood or your own sale or purchase? Get in touch — I'm always happy to walk through what the numbers mean for you.